One of the most important tools for furthering innovation is advanced research computing (ARC). Researchers working with large and complex data often use it to translate this information into visualizations. These data visualizations make it possible to understand information in more productive ways, identify new connections between data components, and answer important questions about their work.
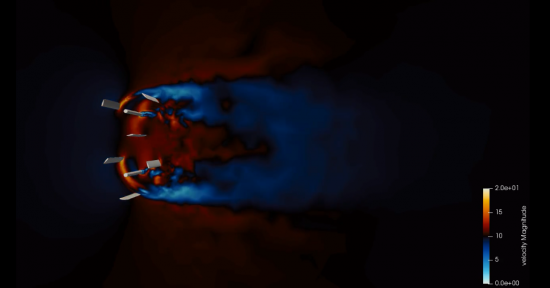
The power of ARC in visualizing big data, and how that advances research, was recently celebrated by the Visualize This! competition by Compute Canada, which, in partnership with four regional organizations, provides essential ARC services and infrastructure to researchers across the country. The competition required creating a visualization of a data set of a multi-scale aerodynamic model of several counter-rotating vertical-axis wind turbines. The competition, which was hosted by Compute Canada regional partner WestGrid and sponsored by Dell EMC and Intel, attracted more than 80 participants, who had two months to create a compelling visualization.
The winner of the competition was Jarno van der Kolk, a post-doctoral fellow at the University of Ottawa. In his five-minute visualization, van der Kolk used attractive graphics, calming music and informative narration to demonstrate what vertical-axis wind turbines are, how they work, and why they are more effective than conventional wind turbines.
“First, I had to read about windmills to better understand why these wind turbines are better than the ones we already have. Then I tried to use the data set to reflect these differences… I tried to express the information as clearly as possible,” says van der Kolk, who works with the University of Ottawa’s Computational Nanophotonics Group.
Van der Kolk’s day-to-day work regularly involves using high-performance computing to process large and complex data sets pertaining to non-linear optics and to create data visualizations. For this work, he uses Shared Hierarchical Academic Research Computing Network, or SHARCNET, which serves 18 academic partner institutions spanning a geographical space of 1,800 km in Ontario, making it the largest HPC consortium in Canada. As a fellow ORION community member, he accesses these services over the ORION network. As well, van der Kolk uses WestGrid, a network of computing facilities and data management services for researchers in Western Canada; and SOSCIP’s BlueGene, Canada’s fastest supercomputer, which is also connected to ORION.
Altogether, these three HPC facilities play a fundamental role in making sense out of big data not only for van der Kolk, but for several thousand researchers throughout Canada. Not only do they make data more accessible to researchers, they allow researchers to share their findings in a meaningful way with other researchers, the general public, and organizations that can support and commercialize the data. Ultimately, ARC and the data visualizations it facilitates are a key step in transforming research findings into innovations that advance our society.
“A picture is worth a thousand worlds—with videos and animations, we can see how everything works,” van der Kolk says. “These supercomputers are important for both facilitating my understanding of data, and also synthesizing data for presentations for fellow scientists and the rest of the world.”
Counter-rotating wind turbines by Jarno van der Kolk from Compute Canada on Vimeo.